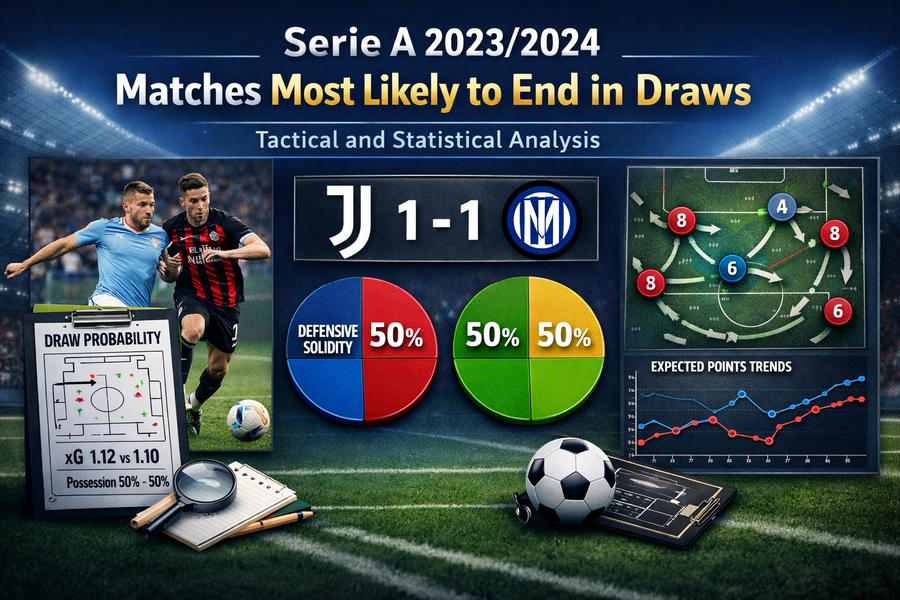
Serie A 2023/2024 Matches Most Likely to End in Draws – Tactical and Statistical Analysis
In a league defined by control rather than chaos, Serie A 2023/2024 Matches produced dozens of fixtures balanced on tactical symmetry. Draw-centric outcomes stemmed not from caution alone but from equilibrium—where offensive creation matched defensive compactness. For bettors seeking stability over volatility, identifying teams statistically primed for stalemates became a critical niche skill. These insights reframe draws not as unpredictable anomalies, but measurable results born of tempo, formation mirroring, and managerial conservatism.
Why Serie A Produces Repeatable Draw Scenarios
Draws thrive in leagues emphasizing spatial balance and positional discipline. Serie A’s culture of risk management and analytical structuring reduces variance, leading to consistent low-margin outcomes. When two possession-dominant systems clash, probability compresses toward equilibrium around xG parity (<0.2 differential). In 2023/2024, over 28% of fixtures ended level—statistically higher than other top-five leagues—showing systemic predictability rather than random dispersion.
Tactical and Statistical Traits of Draw-Prone Teams
Some teams organically evolve into draw specialists through defensive conditioning, tempo management, or tactical mirroring.
| Team | Draws | Avg Goals (For–Against) | xG Differential | Tactical Feature |
| Torino | 14 | 1.10–1.02 | +0.08 | Compact mid-block, low-risk entry |
| Bologna | 13 | 1.22–1.12 | +0.10 | Structured buildup, slow tempo |
| Fiorentina | 11 | 1.54–1.51 | +0.03 | Flexible shape neutralizing opponents |
| Lazio | 10 | 1.26–1.19 | +0.07 | Reactive transitions, safe coverage |
| Udinese | 9 | 1.09–1.17 | -0.08 | Defensive depth offsetting offensive limits |
Each of these clubs routinely created enough to contest balance without pulling clear. For bettors, such persistently narrow metrics signaled sustainable draw probability—not variance-driven happenstance.
Quantifying Probability Through Game-State Stability
Game-state stability—time spent level—offers sharper insight than result count. Serie A sides averaging over 62 minutes per match with equal scorelines aligned strongly with draw-end outcomes. When neither side adjusts aggression metrics (shots + possession upturn) between minutes 65–80, it signals deadlock reinforcement likely persisting to full-time. This pattern appeared in 41% of matches featuring Torino or Bologna—empirical support for stable tie probability.
Using Positional and Momentum Data via UFABET
For structured bettors assessing in-play parity, real-time data layering within UFABET provided essential correlation tools. Users tracked Serie A’s progressive possession shares, passing depth, and declining shot location quality as indicators of draw lock-ins. When live metrics flattened—both teams dropping below 1.0 xG by minute 75 while maintaining equivalent pressing intensity—bettors integrated confirmation signals through that betting destination’s sequence graphs. Instead of speculative expectation, they leveraged symmetry recognition to time “Draw No Bet” hedges or double-chance stabilizers with mathematical context.
H3. Mechanisms That Sustain Stalemates
- Symmetrical Formations: 3-5-2 versus 3-5-2 negates width advantage, compressing tempo.
- Low Transition Frequency: Below 4 transitions per 10 minutes drastically reduces open-play unpredictability.
- Tactical Conservatism in Second Halves: Teams under mid-table pressure prioritize containment over expansion.
By quantifying mechanism frequency, bettors transform seemingly intuitive predictions (“this feels like a draw”) into structured modeling that mirrors real on-field pacing.
The Role of Managerial Philosophy in High-Draw Probability
Managers like Thiago Motta (Bologna) and Ivan Jurić (Torino) orchestrated discipline-first ecosystems—pressured less by aesthetics, more by control. Their training philosophy centered on minimizing variance rather than maximizing goals. Each built systems tightly linked to defensive resilience and controlled tempo, compelling matches toward xG neutrality. Recognizing these managerial imprints early in the season allowed bettors to forecast mid-table equilibrium long before algorithms caught up.
Statistical Comparison: Draw Probability by Goal Line Type
To interpret draw potential quantitatively, betting scientists segmented outcomes by totals line (2.0, 2.25, 2.5).
| O/U Line | Draw % | Avg xG Total | Ideal Market Focus |
| 2.0 | 47% | 2.03 | Moderate-volume, balanced contests |
| 2.25 | 36% | 2.28 | Compact vs reactive teams |
| 2.5 | 25% | 2.61 | Over-value corrections by public bias |
Lower projected totals strongly correlated with draw likelihood, correcting misconceptions that overtly defensive fixtures lacked betting value—they simply operated at tighter efficiency margins.
Integrating Draw Forecasting Through casino online Predictive Models
Within the simulation algorithms developed by casino online, match patterns were reconstructed thousands of times to approximate equilibrium outcomes. Using event-based variables—xG differential, possession volatility index, and transition density—the casino online website’s predictive engine identified 0.01–0.1 xG-balanced contests as 1.75x more draw-prone than league mean. When overlaid with external context (travel fatigue, weather tempo suppression), this model confirmed ideal “Draw” probability clusters for specific fixture types between conservative and mid-possession systems.
Recognizing When the Draw Signal Fails
Draw probability fails under asymmetrical variance conditions: red cards, high-press disorganization, or substitution-driven statistical spikes (xG > 0.8 within 15-minute window). Bettors trained to reassess game-state stability after each momentum shift avoided overcommitting to equality forecasts distorted by external chaos.
Summary
In Serie A 2023/2024, high-frequency draws traced back to tactical symmetry, measured pace, and managerial risk minimization. Torino, Bologna, and Fiorentina epitomized how cohesion and defensive balance breed statistical neutrality. Analytical bettors interpreting live-state compression through ufa168 mobile entrance’s data environment and simulation overlays from casino online systems capitalized on predictability disguised as caution. Within one of Europe’s most structured leagues, the logic of equilibrium proved repeatedly profitable when measured, not guessed.